More on the NAR November 2012 Pending Home Sales Report
In my previous post, I mentioned that while we are nowhere near 2006 levels, this graph further clarifies a few things.
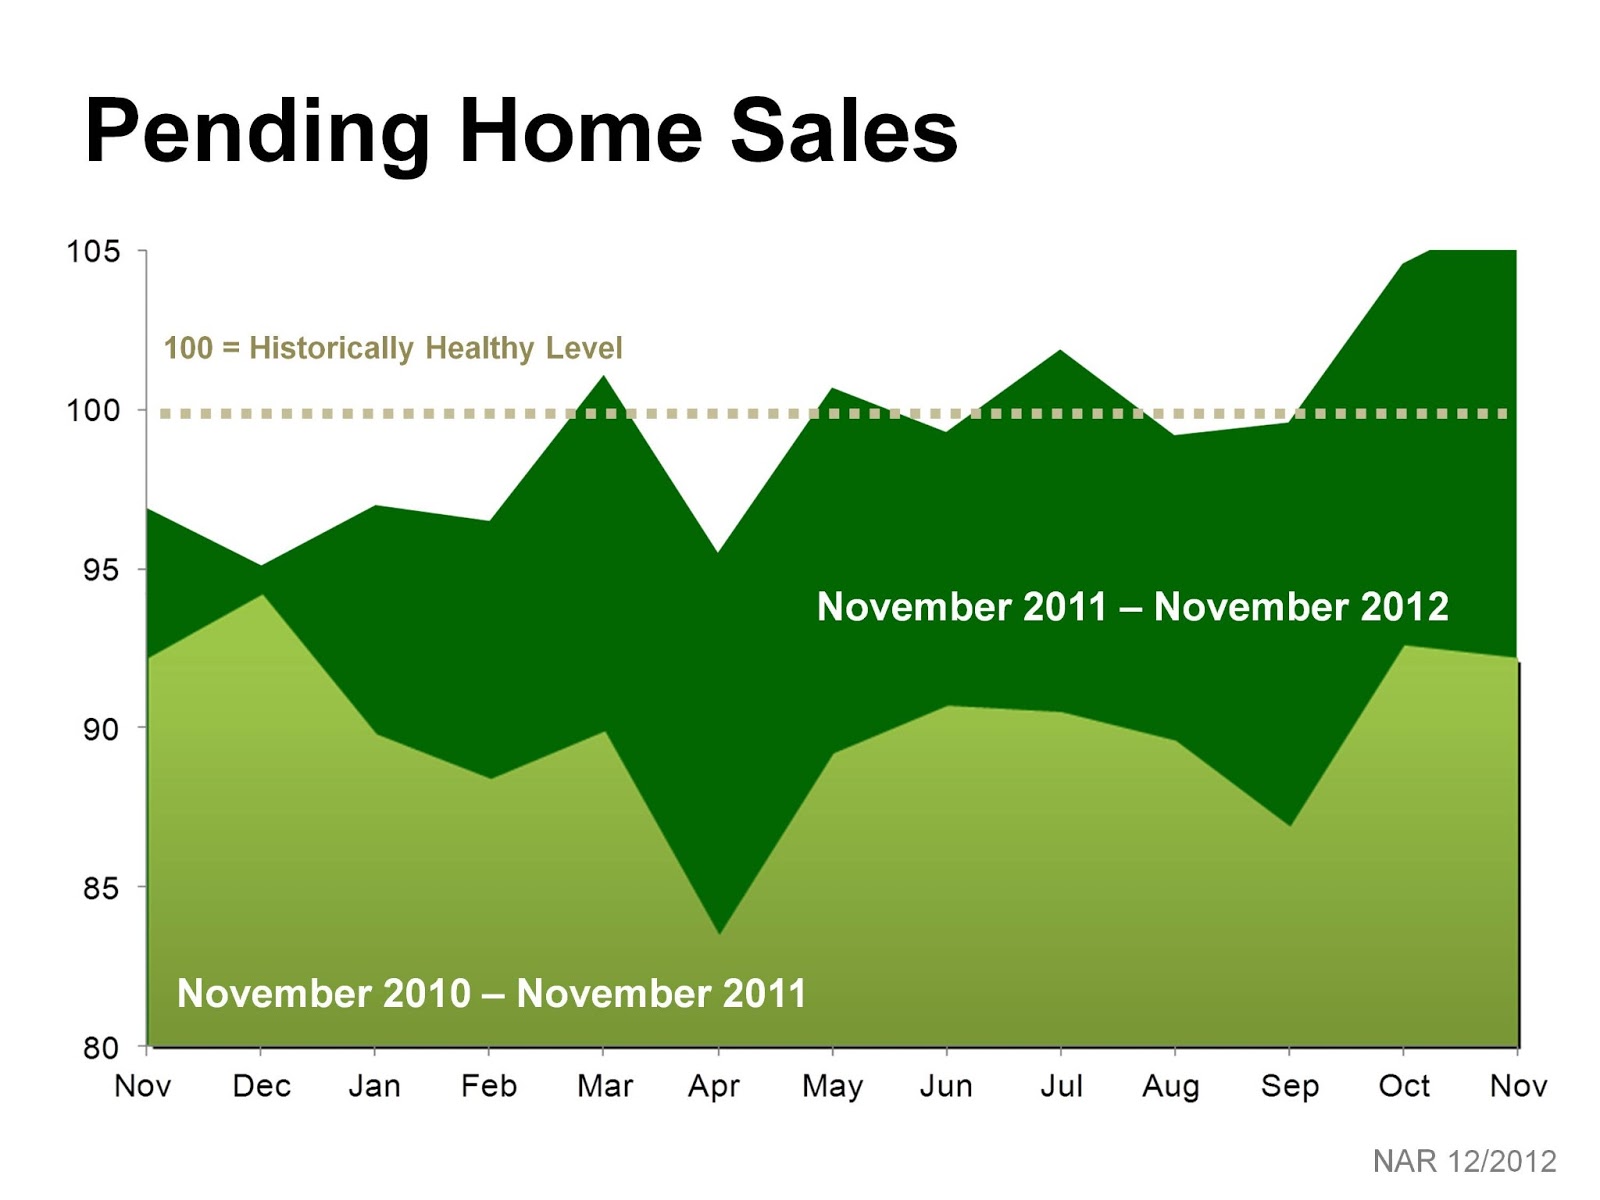
Looking down at the bottom of the graph, I want you to pay close attention to how the last twelve months and the twelve months prior to that are trending.
- November 2010 to November 2011 (the light green on this graph)
- November 2011 to November 2012 (the dark green area)
NAR, who produces the pending home sales report, tracked sales prior to the bubble and what is the historical healthy level of the real estate market. They put that number at 100. (the gold line going across the graph.) Although we were hovering near or at that number for awhile, we have surpassed that number in a big way over the past couple of months.
Call me at (914) 374-8354 for more market trends and information.
No comments:
Post a Comment